07. References: Feature Extraction
References: Feature Extraction
Feature Extraction
A summary of methods used in ASR:
Mel Scale
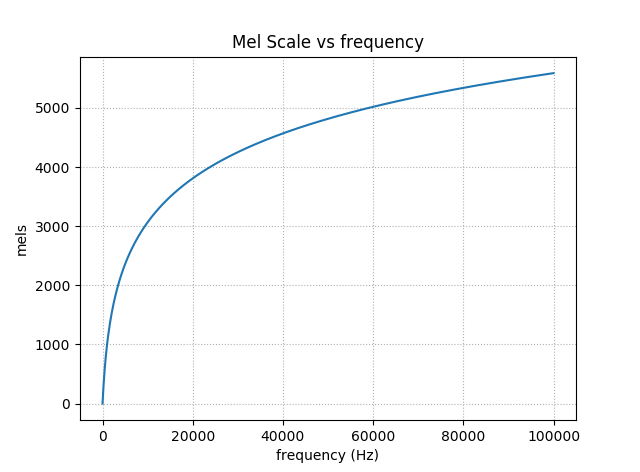
The Mel Scale was developed in 1937 and is based on human studies of pitch perception. At lower pitches (frequencies), humans can distinguish pitches better. Read more about it in Wikipedia
The Source/Filter Model
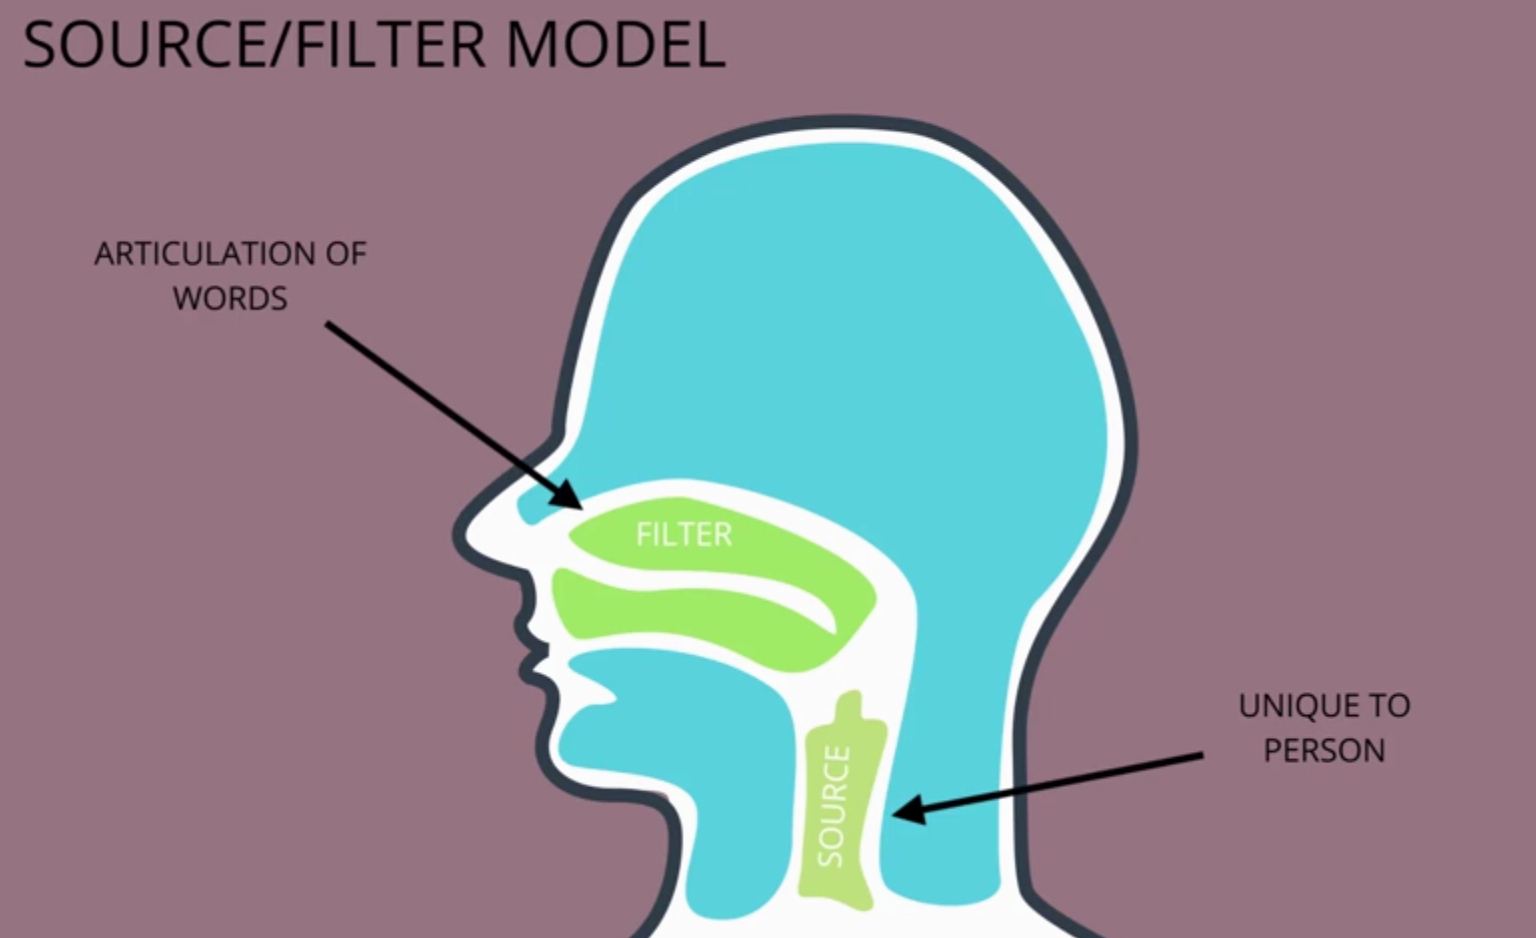
The source/filter model holds that the "source" of voices speech is dependent upon the vibrations initiated in the vocal box, and is unique to the speaker, while the "filter" is the articulation of the words in the forward part of the voice tract. The two can be separated through Cepstrum Analysis. A detailed explanation of the Source/Filter model for speech can be found at:
Cassidy, Steve. "Speech recognition." Sydney Australia (2002): Chapter 7.
Cepstral Analysis
The source/filter model motivates Cepstral Analysis. The intuition is that the "source" e(n) is multiplied by the "filter" h(n) to form the signal, s(n):
s(n) = e(n)\times h(n)
This signal can be converted to the frequency domain through a discrete Fourier transform, or DFT (can use the FFT algorithm):
\left |S(\omega) \right | = \left |E(\omega) \right | \cdot \left |H(\omega) \right |
Take the log and we can just add the source and filter instead of multiplying:
\log\left |S(\omega) \right | = \log\left |E(\omega) \right |+\log\left |H(\omega) \right |
Here's where it gets a bit tricky. By taking the inverse discrete Fourier transform, or IDFT, the signal can be split. This is the cepstrum c(n) . Here's the final equation:
c(n) = IDFT(\log\left |S(\omega) \right |) = IDFT(\log\left |E(\omega) \right |+\log\left |H(\omega) \right |)
Because we are splitting the logs of the frequencies, this is not the same as the original time domain, but rather now called the quefrency or cepstral domain. The vocal tract, or filter components that we want, can be extracted now because they vary slowly and are concentrated in the lower quefrency region.
Read more in the following thorough treatment complete with diagrams:
MFCC
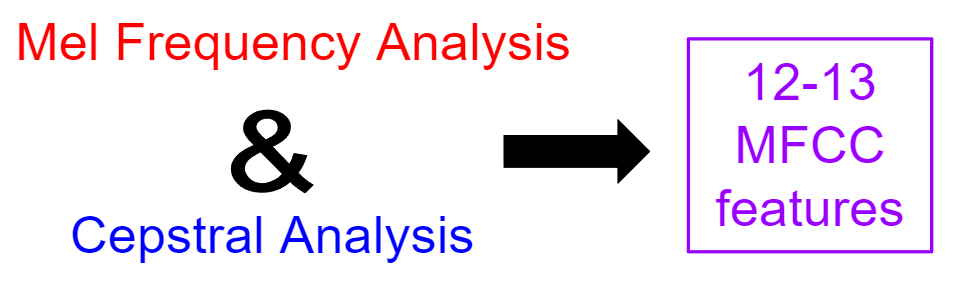
Mel Frequency Cepstrum Coefficient Analysis is the reduction of an audio signal to essential speech component features using both mel frequency analysis and cepstral analysis. The range of frequencies are reduced and binned into groups of frequencies that humans can distinguish. The signal is further separated into source and filter so that variations between speakers unrelated to articulation can be filtered away. The following reference provides nice visualizations of the process of audio->spectrogram->MFCC:
MFCC Deltas and Delta-Deltas
Intuitively, it makes sense that changes in frequencies, deltas, and changes in changes in frequencies, delta-deltas, might also be meaningful features in speech recognition. The following succinct tutorial for MFCC's includes a short discussion on deltas and delta-deltas:
Mel Frequency Cepstral Coefficient (MFCC) tutorial. Practical Cryptography